wxMathPlot
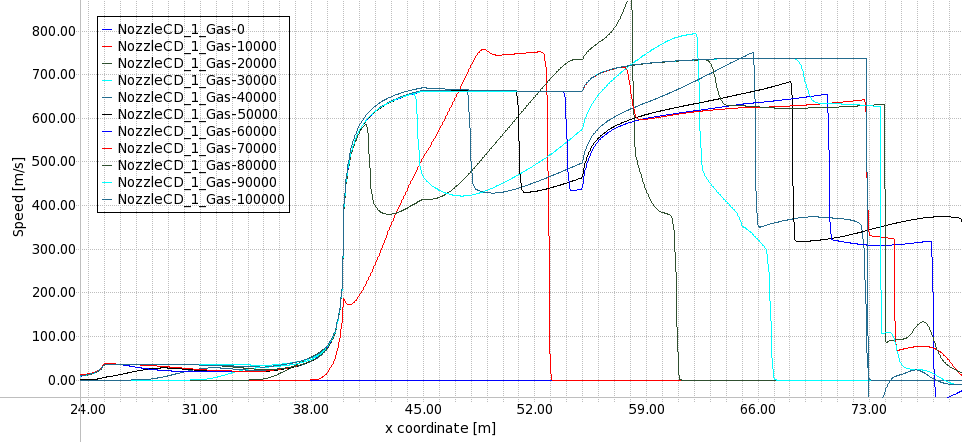
wxMathPlot is a library to add 2D scientific plot functionality to wxWidgets. It allows to embed inside your program a window for plotting scientific, statistical or mathematical data, with additions like legend or coordinate display in overlay.
wxMathPlot is distributed under the therms of the wxWindows License
wxMathPlot main features:
- Completely mouse-driven view control: pan, zoom, scroll, box positioning.
- Printing class.
- Screenshot saving of plot window(BMP, PNG and JPEG formats).
- Overlay movable boxes with legend or mouse coordinate display.
- Can set margins to avoid plots to cover axis labels.
- Flexible axis positioning
- A series of useful layer to directly plot data from STL vector, movable objects, covariance ellipse, bitmaps, etc.
- Multi-platform: runs everywhere wxWidgets does.
Authors
From June 2007 the project is maintained by Davide Rondini <cdron77@users.sourceforge.net>, who carries on the original work by David Schalig <mrhill@users.sourceforge.net>.
Authors can be contacted via the wxMathPlot's homepage at https://sourceforge.net/projects/wxmathplot.
Contributors: Jose Luis Blanco, Val Greene.


